Production possibility curve (PPC) diagrams
Key definition: A production possibility curve (PPC) shows the maximum possible combinations of two goods or services that an economy can produce using all its current resources and production methods efficiently.
What a PPC shows
- Productive efficiency - producing the maximum possible output from the available resources.
- Productive capacity - the maximum output an economy can produce with its available resources and production methods.
A PPC simplifies the economy by placing one good or category of goods on each axis. In the diagrams below, consumer goods are products made for people's direct use, while capital goods are man-made goods used to produce other goods and services.
The curve is a boundary: it shows the economy's productive capacity. It is normally downward sloping because scarce resources have alternative uses. Producing more of one good therefore usually requires the economy to produce less of the other.
Reading the axes: A point's horizontal position shows the quantity of consumer goods produced; its vertical position shows the quantity of capital goods produced.
Points on, inside and beyond a PPC
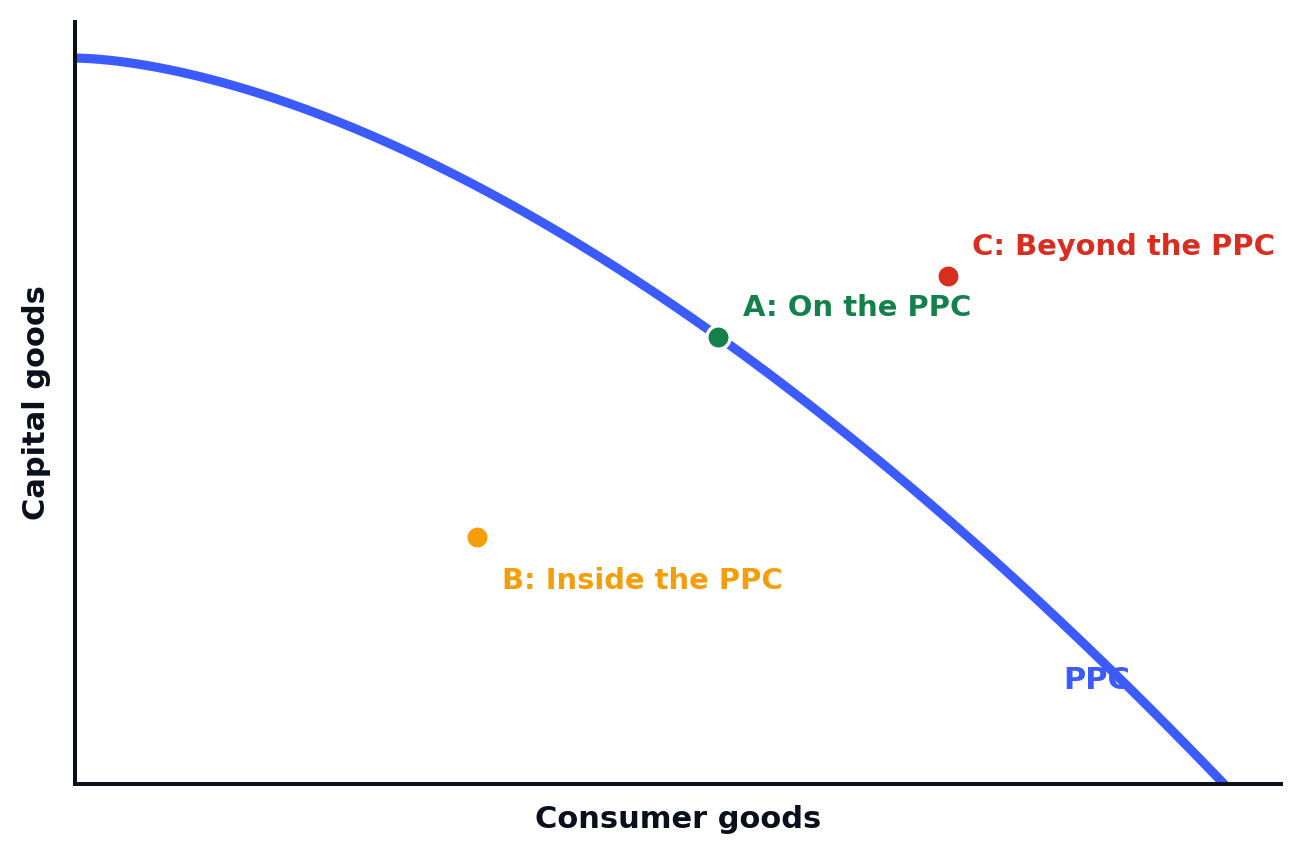
Figure 1. Points on, inside and beyond a production possibility curve.
| Position | What it means | Why |
|---|---|---|
| On the PPC (A) | Attainable and productively efficient. | Resources are fully and effectively used, so output is at the current maximum. |
| Inside the PPC (B) | Attainable but productively inefficient. | Some resources are unemployed, unused or poorly allocated. At least one output could rise without reducing the other. |
| Beyond the PPC (C) | Unattainable at present. | Current resources and production methods are insufficient, although the point may become attainable if productive capacity rises. |
Movements along a PPC
A movement along the same PPC occurs when an economy reallocates its existing resources between the two goods. Its productive capacity has not changed, so the curve itself does not shift.
Because both points are on the boundary, gaining more of one good requires sacrificing some of the other. The quantity of the other good foregone is the opportunity cost of the increase.
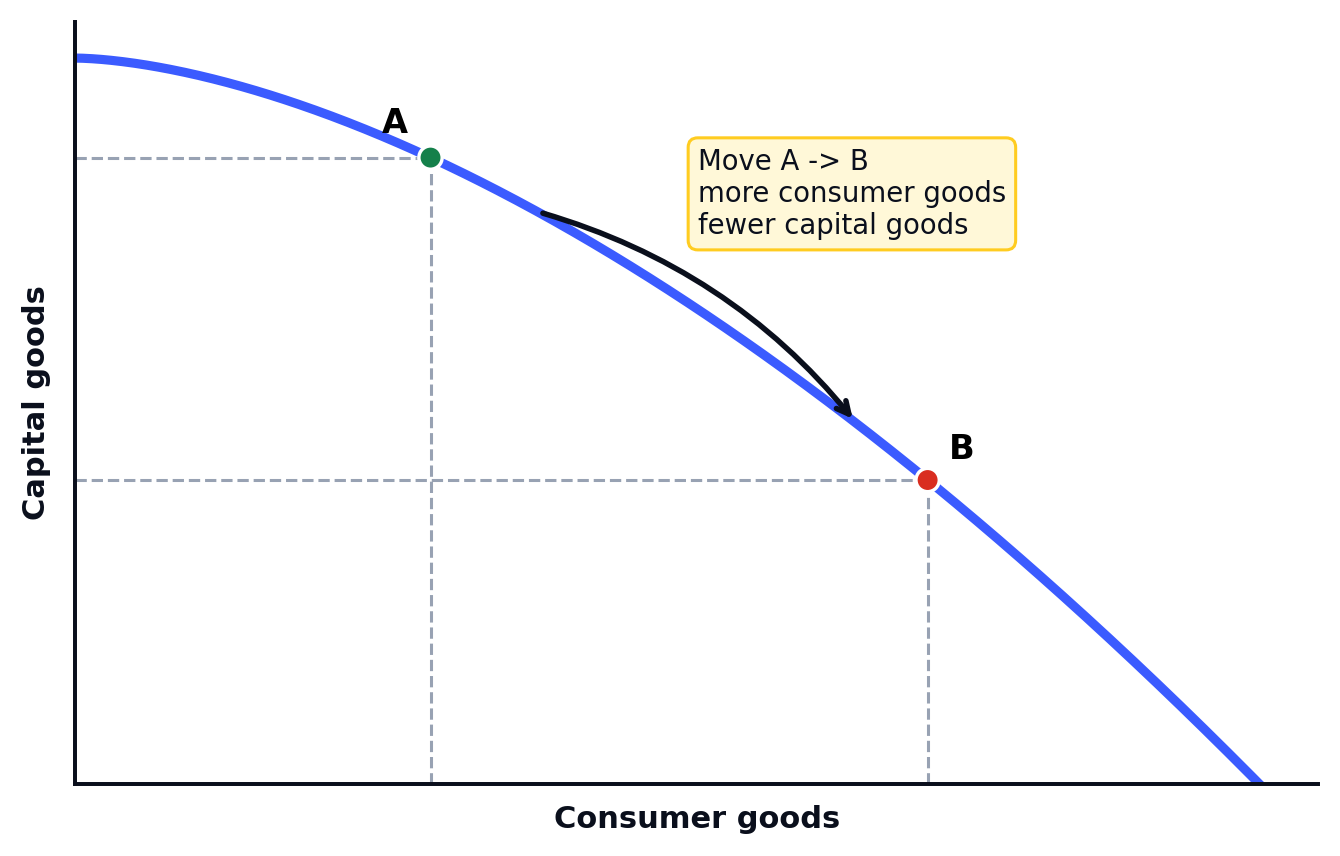
Figure 2. A movement along a PPC from A to B.
Interpretation: Moving from A to B increases consumer-goods output but reduces capital-goods output. The capital goods foregone are the opportunity cost of producing the additional consumer goods.
How to explain a movement
State which good increases.
State which good decreases.
Identify the decrease as the opportunity cost of the increase.
Shifts of a PPC
- Economic growth - an increase in an economy's productive capacity, allowing it to produce more goods and services than before.
A shift changes the position of the entire PPC because productive capacity has changed. It is different from a movement between two points on the same curve.
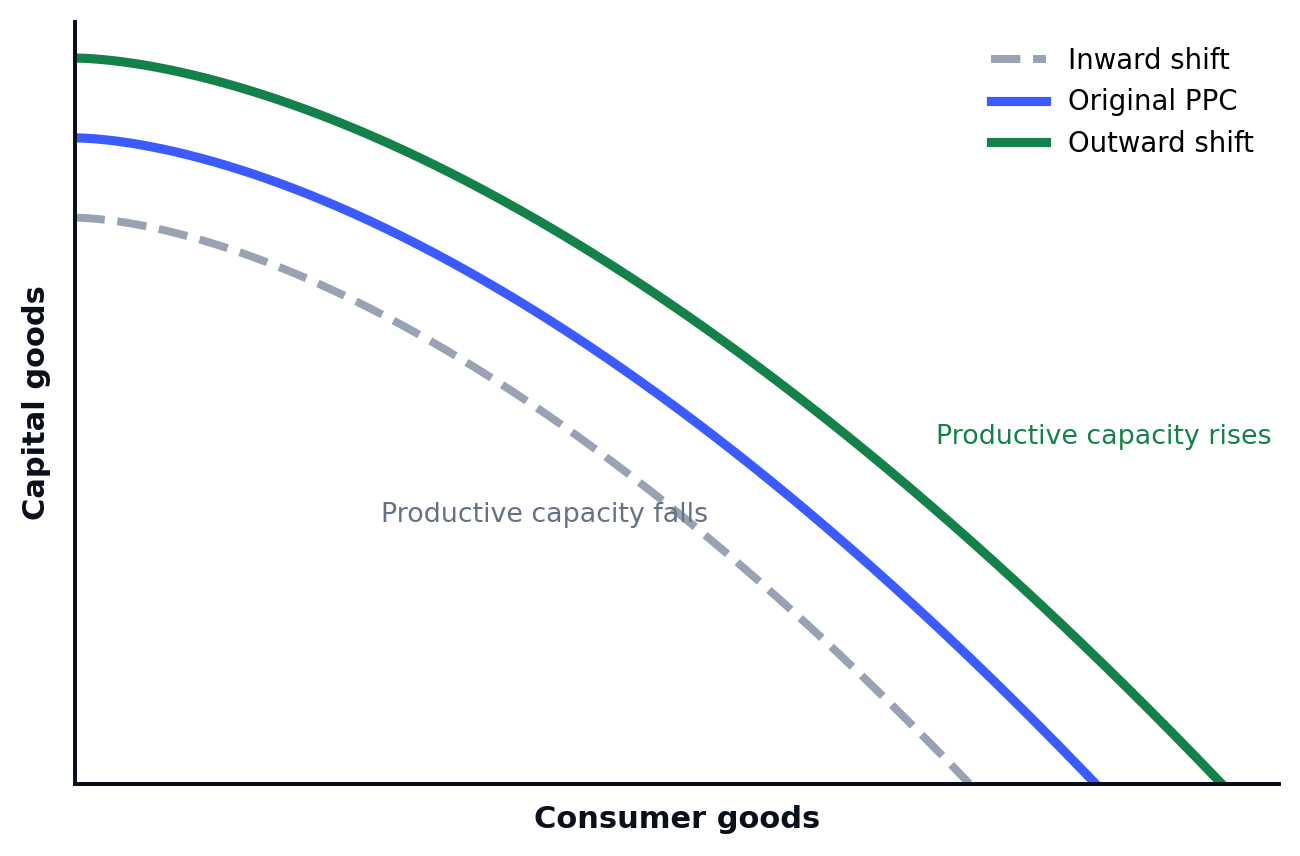
Figure 3. Inward and outward shifts of a PPC.
Outward and inward shifts
| Change | Meaning | Possible causes | Consequence |
|---|---|---|---|
| Outward shift | Productive capacity increases. | A greater quantity or quality of factors of production; better production methods; discovery of natural resources; more education, training or capital goods. | More output combinations become attainable. This represents potential economic growth. |
| Inward shift | Productive capacity decreases. | War or a natural disaster; destruction of capital goods; loss or depletion of natural resources; a fall in the workforce. | Some combinations that were attainable before can no longer be produced. |
Important distinction: An outward shift shows that the economy can produce more; it does not prove that it is actually producing at that higher level. The economy may still operate at a point inside its new PPC.
If a change mainly improves production of one good, the PPC may shift farther along only one axis rather than moving outward evenly.