Population
How population changes
- Birth rate - the number of live births per 1000 people in a population per year.
- Death rate - the number of deaths per 1000 people in a population per year.
- Immigration - the movement of people into a country to live there.
- Emigration - the movement of people out of a country to live elsewhere.
- Net migration - immigration minus emigration over a period. It is positive when immigration is greater.
- Natural increase - the increase in population caused by the birth rate being higher than the death rate, before migration is considered.
Population-change relationship: Population change = births - deaths + immigration - emigration
Why birth rates vary
| Birth rate tends to be higher when... | Birth rate tends to be lower when... |
|---|---|
| Children provide labour or support parents in old age | Pensions and social protection reduce reliance on children |
| Infant mortality is high, so families have more births | Infant survival and healthcare are strong |
| Education and employment opportunities for women are limited | Women have wider education, careers and control over fertility |
| Contraception and family planning are difficult to access | Contraception is available and affordable |
| Marriage and parenthood occur earlier or large families are culturally preferred | Urban housing, childcare and education costs make children expensive |
Why death rates vary
| Death rate tends to be higher when... | Death rate tends to be lower when... |
|---|---|
| Nutrition, clean water, sanitation and healthcare are weak | Living conditions, vaccination and medical care improve |
| War, disease, pollution or natural disaster is severe | The country is peaceful, safe and environmentally healthier |
| Poverty and dangerous work are widespread | Income, education and workplace safety rise |
| A large share of the population is elderly | The population is young—even if healthcare is not especially strong |
Comparison caution: A high crude death rate does not always mean poor healthcare. A country with a very old population may record more deaths per 1000 people than a younger country.
Why net migration varies
- Push factor - a condition that encourages people to leave a place.
- Pull factor - a condition that attracts people to a place.
| Economic | Social / political | Environmental | Policy |
|---|---|---|---|
| Push: unemployment, low wages Pull: jobs, higher wages | Push: conflict, persecution, poor services Pull: safety, family, education | Push: drought, flood, pollution Pull: safer climate and resources | Visa rules, border controls, recruitment schemes and recognition of qualifications |
Actual migration depends on the difference between home and destination, but also on travel cost, information, legal permission, family ties and whether skills are recognised. A country may simultaneously experience immigration and emigration.
Population structure
- Population structure - the composition of a population, especially by age and gender.
- Population pyramid - a diagram showing the percentage or number of males and females in different age groups.
- Dependent population - people likely to rely financially on the working-age population, commonly children and older people, although not every person in these age groups is dependent.
- Dependency ratio - the number of young and old dependents relative to the working-age population.
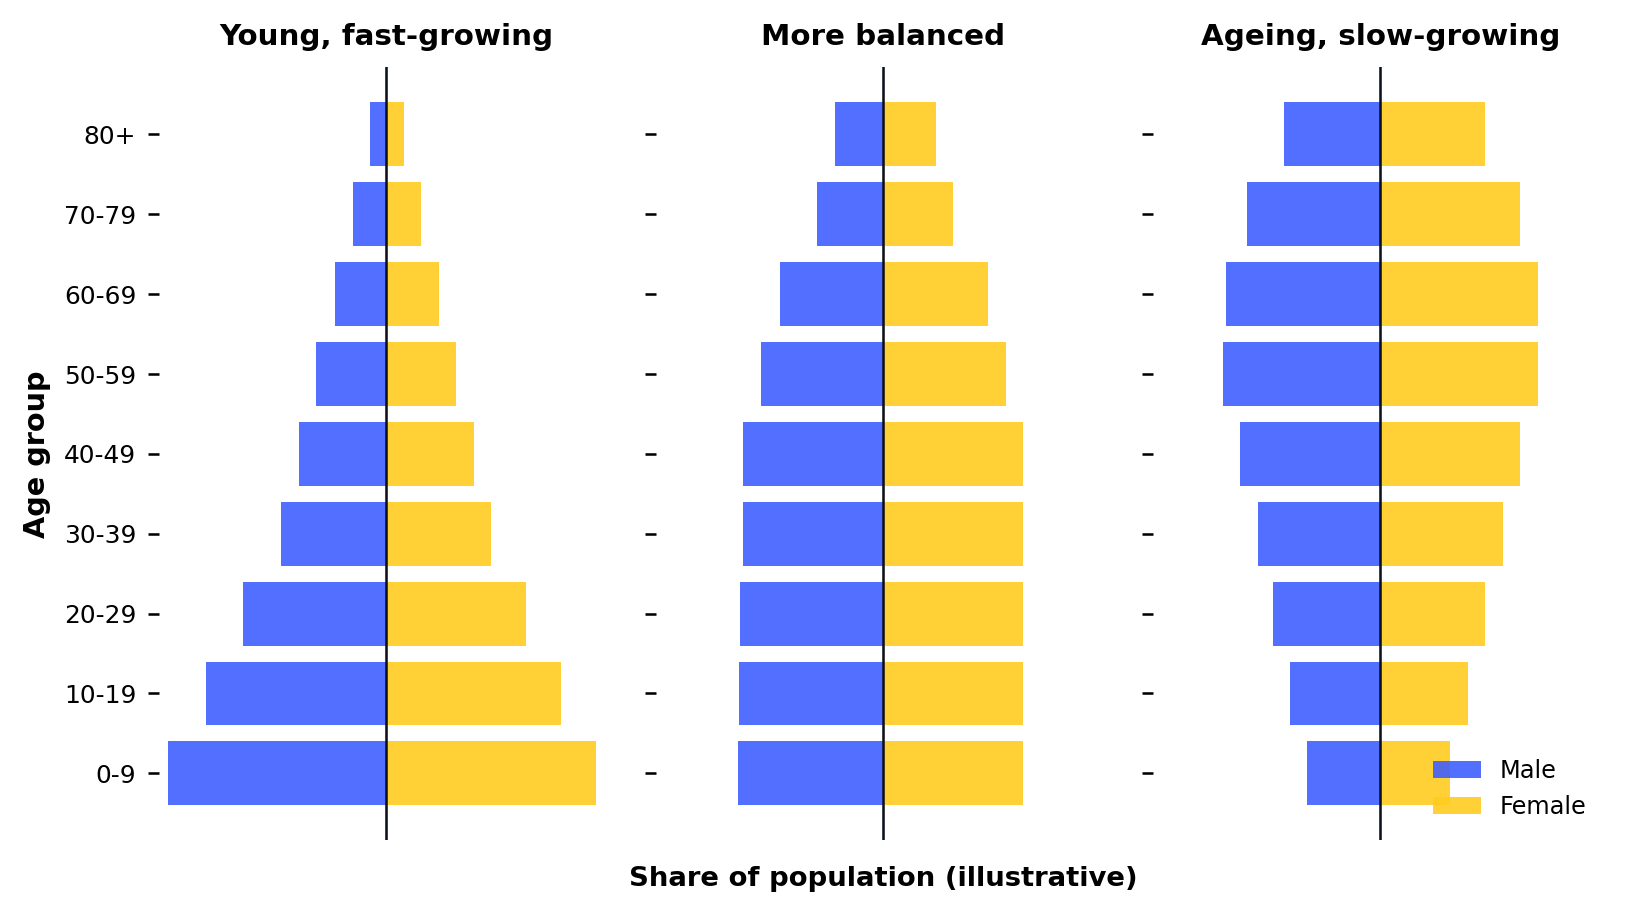
Figure 5.1: Population-pyramid shapes reveal age and gender structure.
Read the vertical axis as age and the width as the size of each group. A broad base suggests many recent births and future entrants to the labour force. A wider top suggests longer life expectancy and an ageing population. A gap on one side may reflect migration, conflict or different life expectancy by gender.
Effects of an increase in population size
| Possible benefits | Possible costs |
|---|---|
| Larger labour force and potential output | Pressure on housing, schools, healthcare, transport, water and energy |
| Larger domestic market can attract firms and allow economies of scale | Unemployment or lower wages if jobs do not grow as quickly |
| More taxpayers can support public services and pensions | Congestion, pollution and faster resource depletion |
| Immigrants may fill skill shortages and bring enterprise | Rapid change may create integration or regional pressures |
The result depends on age, skills, employment and productive capacity. Growth dominated by working-age, skilled people can raise output and tax revenue. Growth dominated by dependants raises immediate pressure on working households and public services, though children may become future workers.
Effects of a decrease in population size
| Possible benefits | Possible costs |
|---|---|
| Less pressure on land, housing, infrastructure and the environment | Smaller labour force, tax base and domestic market |
| Possible reduction in unemployment when job numbers are unchanged | Skill shortages and weaker business investment |
| More capital or resources per person may raise output per head | Ageing and pension/healthcare costs if young people are the main emigrants |
Effects of changes in age and gender distribution
| Structural change | Likely economic effects |
|---|---|
| Larger child population | Higher spending on schools, childcare and paediatric health; high dependency now but possible larger future labour force. |
| Larger working-age population | Potential demographic dividend: more labour, saving and tax revenue if jobs and skills are available. |
| Larger elderly population | Higher pension, healthcare and care needs; possible labour shortages, later retirement and demand for age-related services. |
| Gender imbalance | Changes household formation, birth rates and labour supply; may arise from migration, conflict or discrimination. |
- Demographic dividend - the potential growth benefit from a large working-age population relative to dependants, provided workers are healthy, skilled and employed.
Optimum population
- Optimum population - the population size that, given current resources and technology, produces the highest possible output per head.
- Under-population - a population below the optimum, so some resources and potential economies of scale are not fully used.
- Over-population - a population above the optimum, so resources are stretched and output per head is lower than its possible maximum.
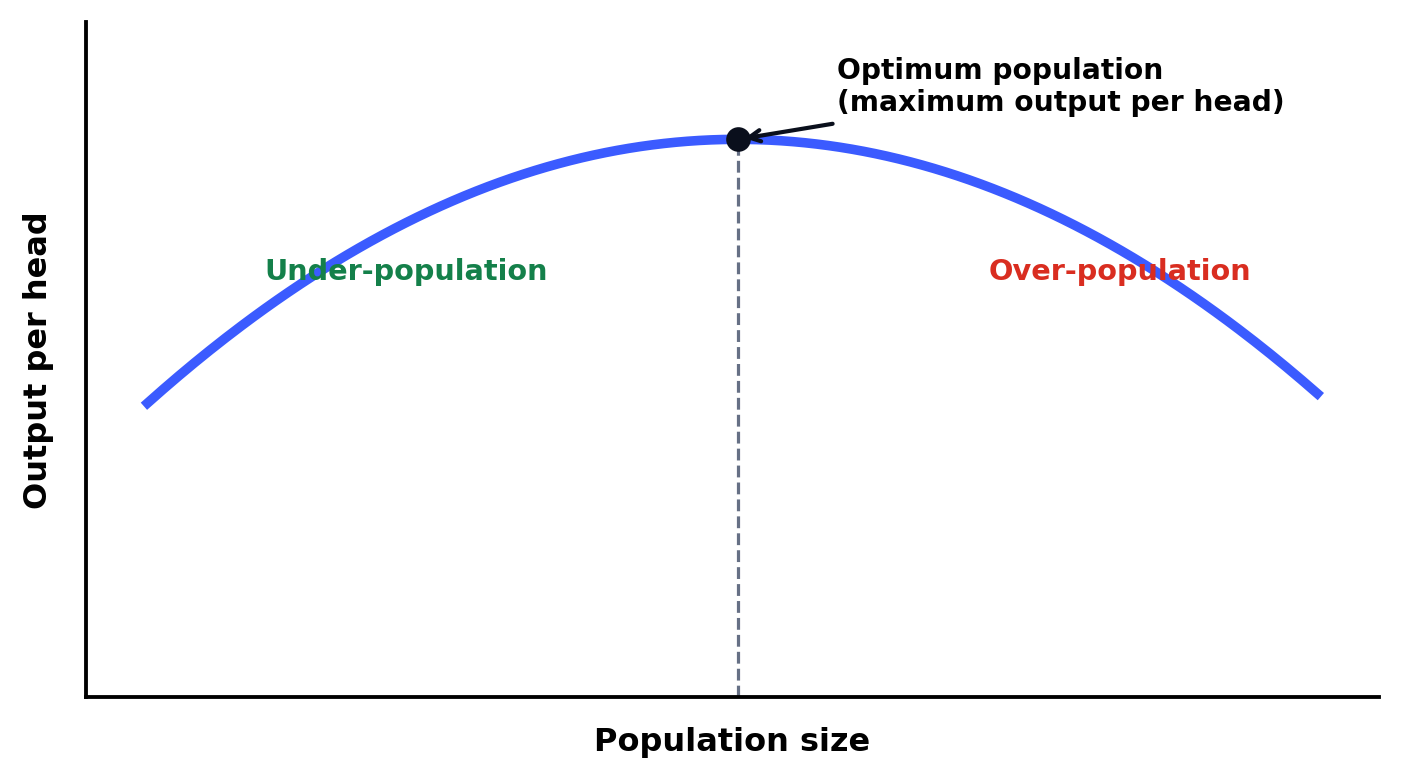
Figure 5.2: The optimum population maximises output per head.
When population is very small, growth may improve specialisation, market size and use of infrastructure, so output per head rises. Beyond the optimum, congestion and pressure on land, capital and services may reduce output per head.
Critical point: The optimum is not fixed. Better technology, education, capital or newly available resources can raise productive capacity and move the optimum to a larger population.