Supply
Meaning of supply
- Supply - the quantity that a producer is willing and able to produce at a given time at a given price.
- Individual supply - the supply of one producer.
- Market supply - the total supply of all producers in a market. It is found by adding individual quantities supplied at each price.
| Price ($) | Firm A | Firm B | Market supply |
|---|---|---|---|
| 10 | 1 | 2 | 3 |
| 20 | 3 | 4 | 7 |
| 30 | 5 | 6 | 11 |
The supply curve
- Supply curve - a line showing the relationship between a product's price and the quantity supplied, with other influences unchanged (ceteris paribus).
- Extension of supply - a rise in quantity supplied caused by a rise in the product's price. It is a movement up the existing supply curve.
- Contraction of supply - a fall in quantity supplied caused by a fall in the product's price. It is a movement down the existing supply curve.
A supply curve normally slopes upwards. A higher price makes production more rewarding, so existing firms try to sell more and other firms may enter the market.
Supply shifts
- Increase in supply - producers offer more at every price, so the whole supply curve shifts right.
- Decrease in supply - producers offer less at every price, so the whole supply curve shifts left.
- Indirect tax - a levy placed by the government on spending or production. It raises a firm's cost of supplying the taxed product, thus making it less profitable to produce.
- Subsidy - a government payment/grant to a producer. It lowers the firm's cost of supplying the supported product.
| Cause | Supply increases when... | Supply decreases when... |
|---|---|---|
| Production costs | wages, energy or raw-material costs fall | these costs rise |
| Productivity / technology | workers or machines produce more efficiently | productivity falls or equipment is disrupted |
| Indirect tax | a tax is reduced or removed | a tax is introduced or increased |
| Subsidy | a subsidy is introduced or increased | a subsidy is removed or reduced |
| Number of firms | more firms enter the market | firms leave the market |
| Weather / natural events | conditions improve agricultural output | poor weather or disaster damages output |
| Expected future price | producers expect a price fall and sell now | producers expect a price rise and hold stock back |
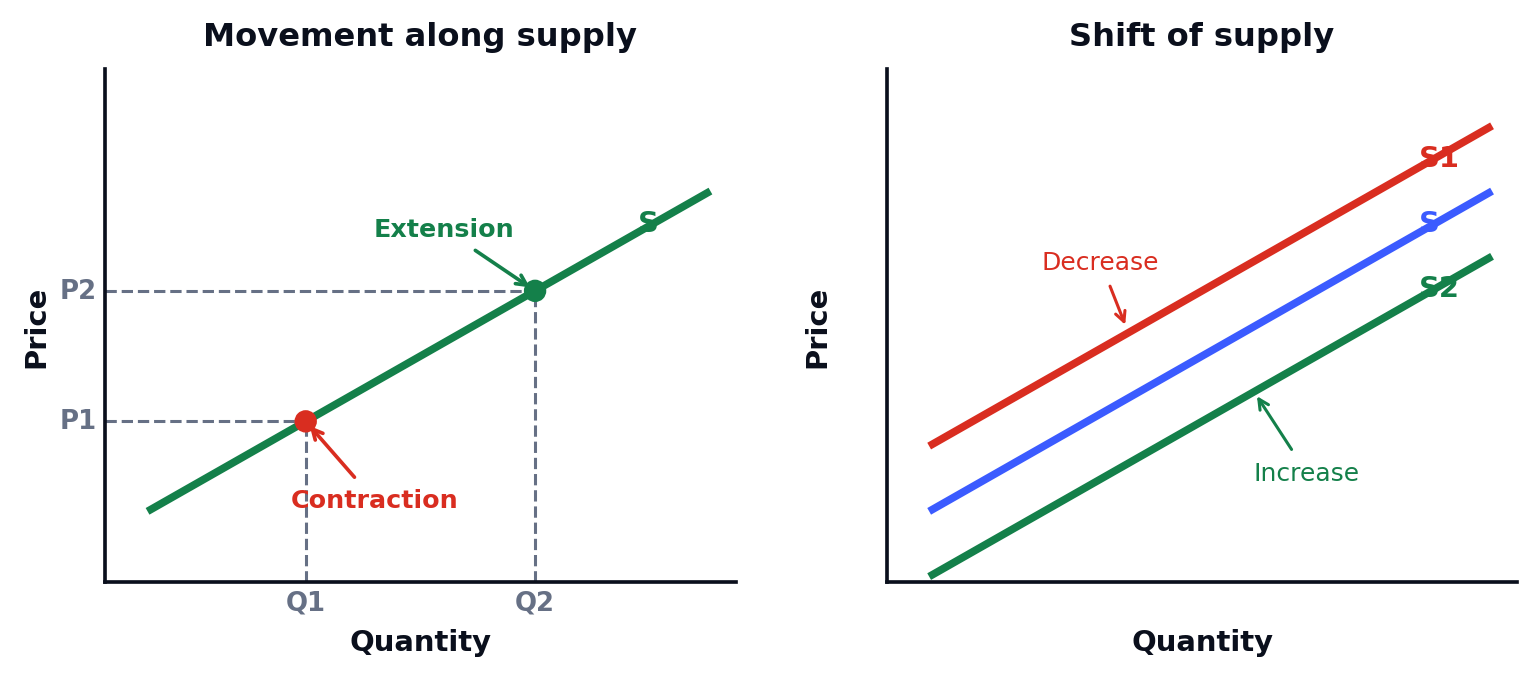
Figure 2.2: A price change causes movement along S; another influence causes S itself to shift.